This page provides a detailed logging of alerts, which criteria and conditions had been satisfied by the readings made by the sensors, resulting to alerts being triggered. It also shows the details of what specific alerts had been triggered and the sensor readings that caused them. Aside from that, this view offers the functionality to resolve alerts, so they would no longer be shown from the dashboard view. Below are the details of this page.
Alert Grid
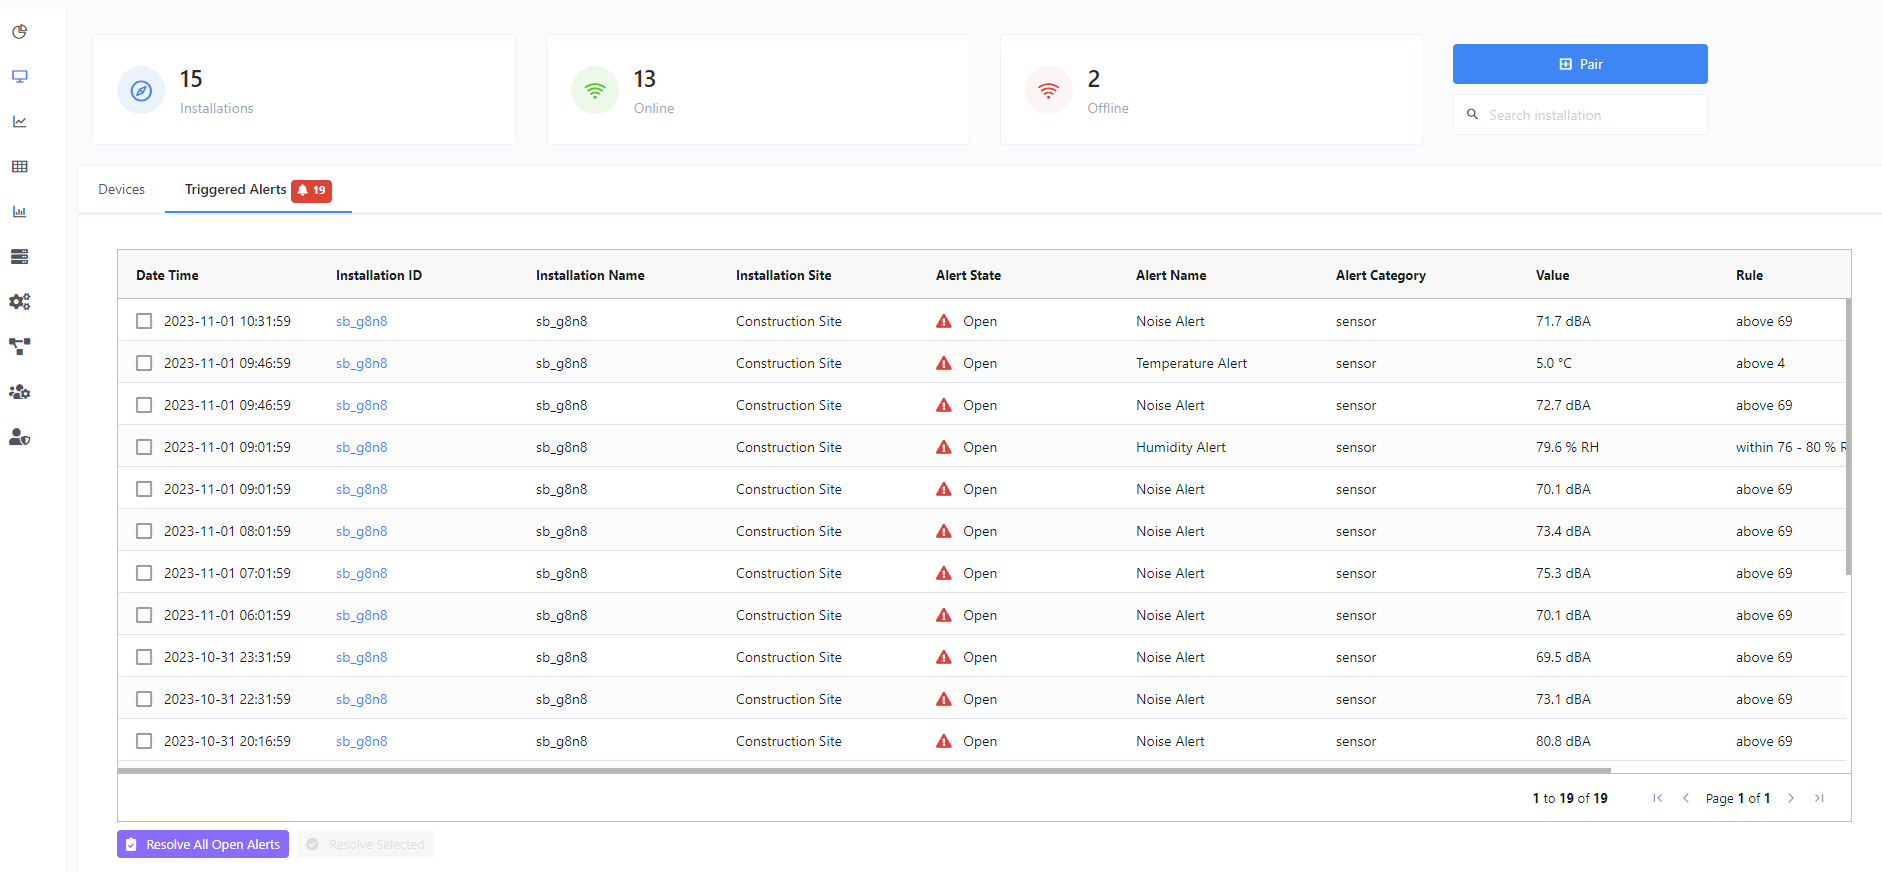
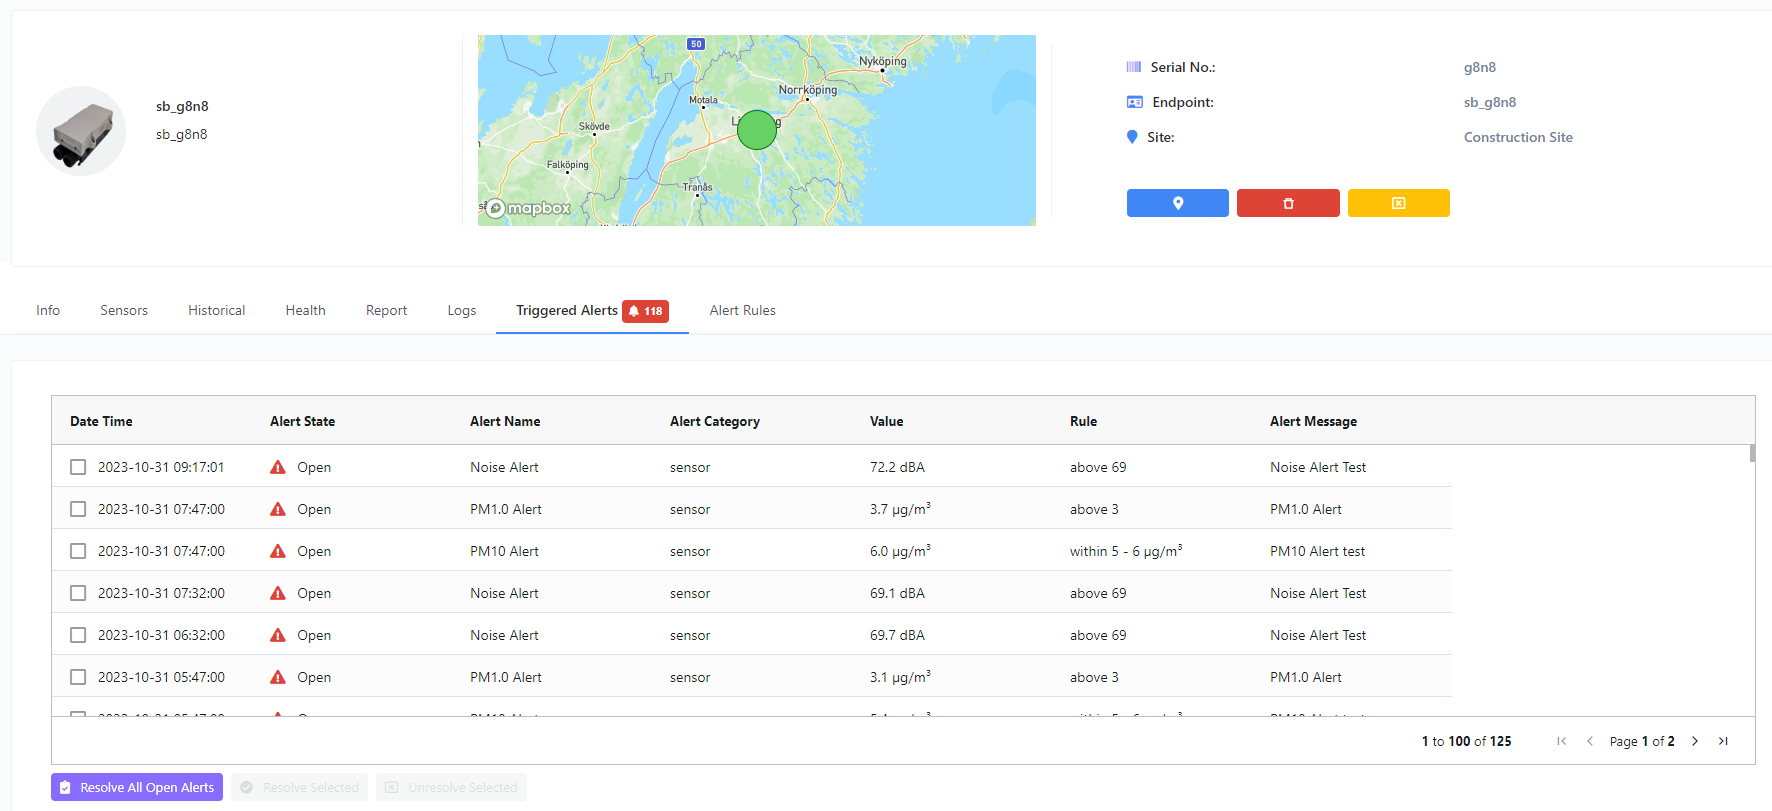
The following are the columns that you can see from the grid:
- Date Time - The timestamp when the alert was triggered.
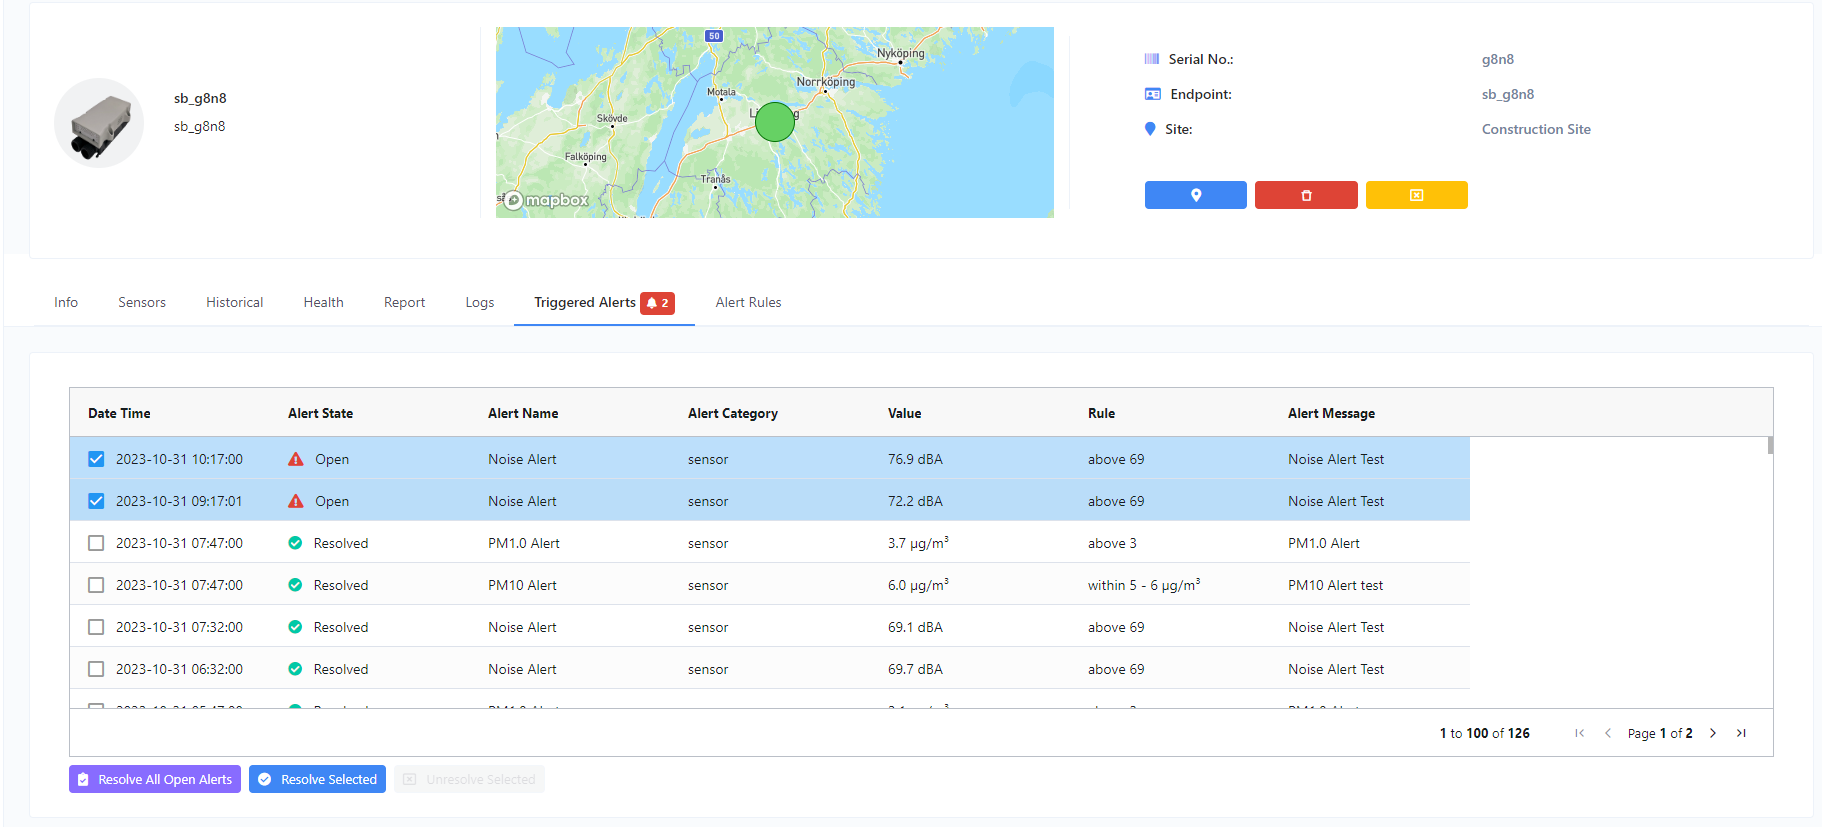
- Alert State - The alert state, resolved or unresolved.
- Alert Name - The name assigned to a specific alert rule that was triggered.
- Alert Category - The category of alert, Sensor Alert or Health Alert.
- Value - The sensor reading that caused or triggered the alert.
- Rule - The alert criteria and conditions.
- Alert Message - The notification message of the alert. This message is also sent to the user via email or SMS.
Functionalities
The following are the set of functionalities that you can interact with the alert grid:
- Resolve All Open Alerts - The function to resolve all opened or unresolved alerts.
- Resolve Selected - The function to resolve only the selected opened or unresolved alerts.
- Unresolve Selected - The function to re-open the selected alerts that have been resolved already.
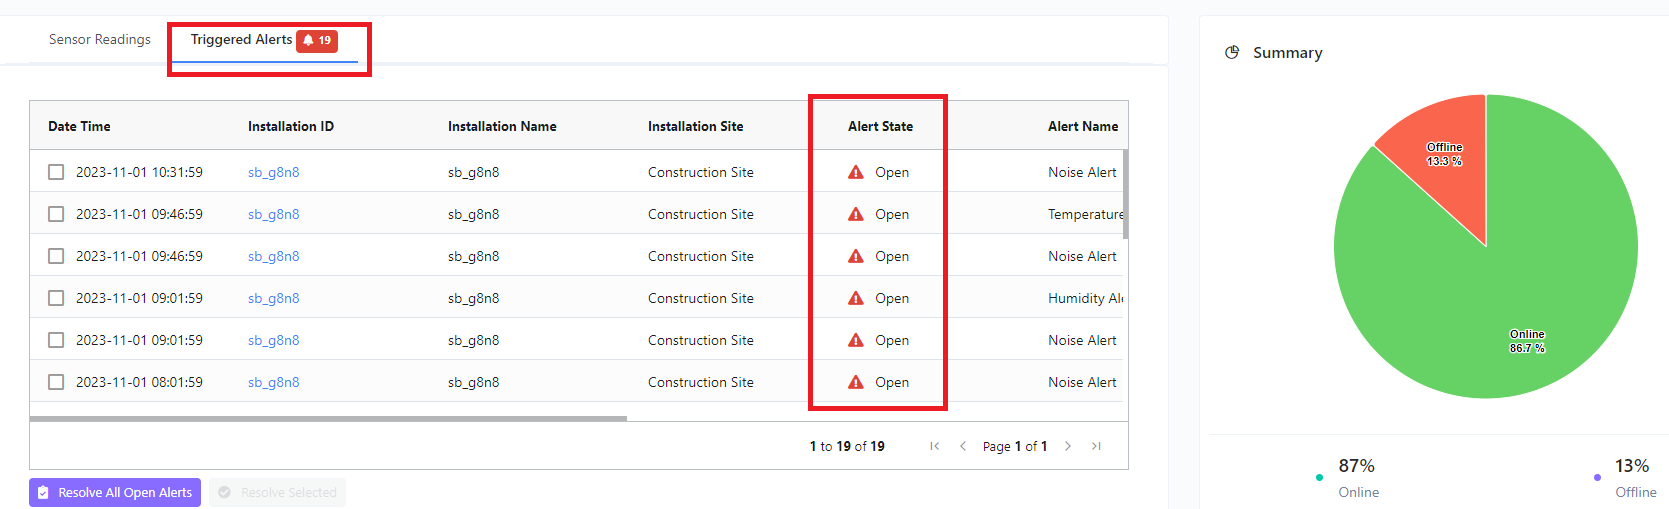
Dashboard Triggered Alerts
You can also find triggered alerts from the /dashboard and /devices page. But these will only display “Unresolved” alerts. Additionally, you can resolve alerts from these pages.