The Sensorbee dashboard page provides an overview of the status and activity of your Sensorbee devices. You can see a list of all devices and their current status, such as online or offline. You can also view detailed information about each device, such as the battery level, the number of datasets received, and the current firmware version. Additionally, you can view recent sensor readings as an overview of the sensor values coming in to your account.
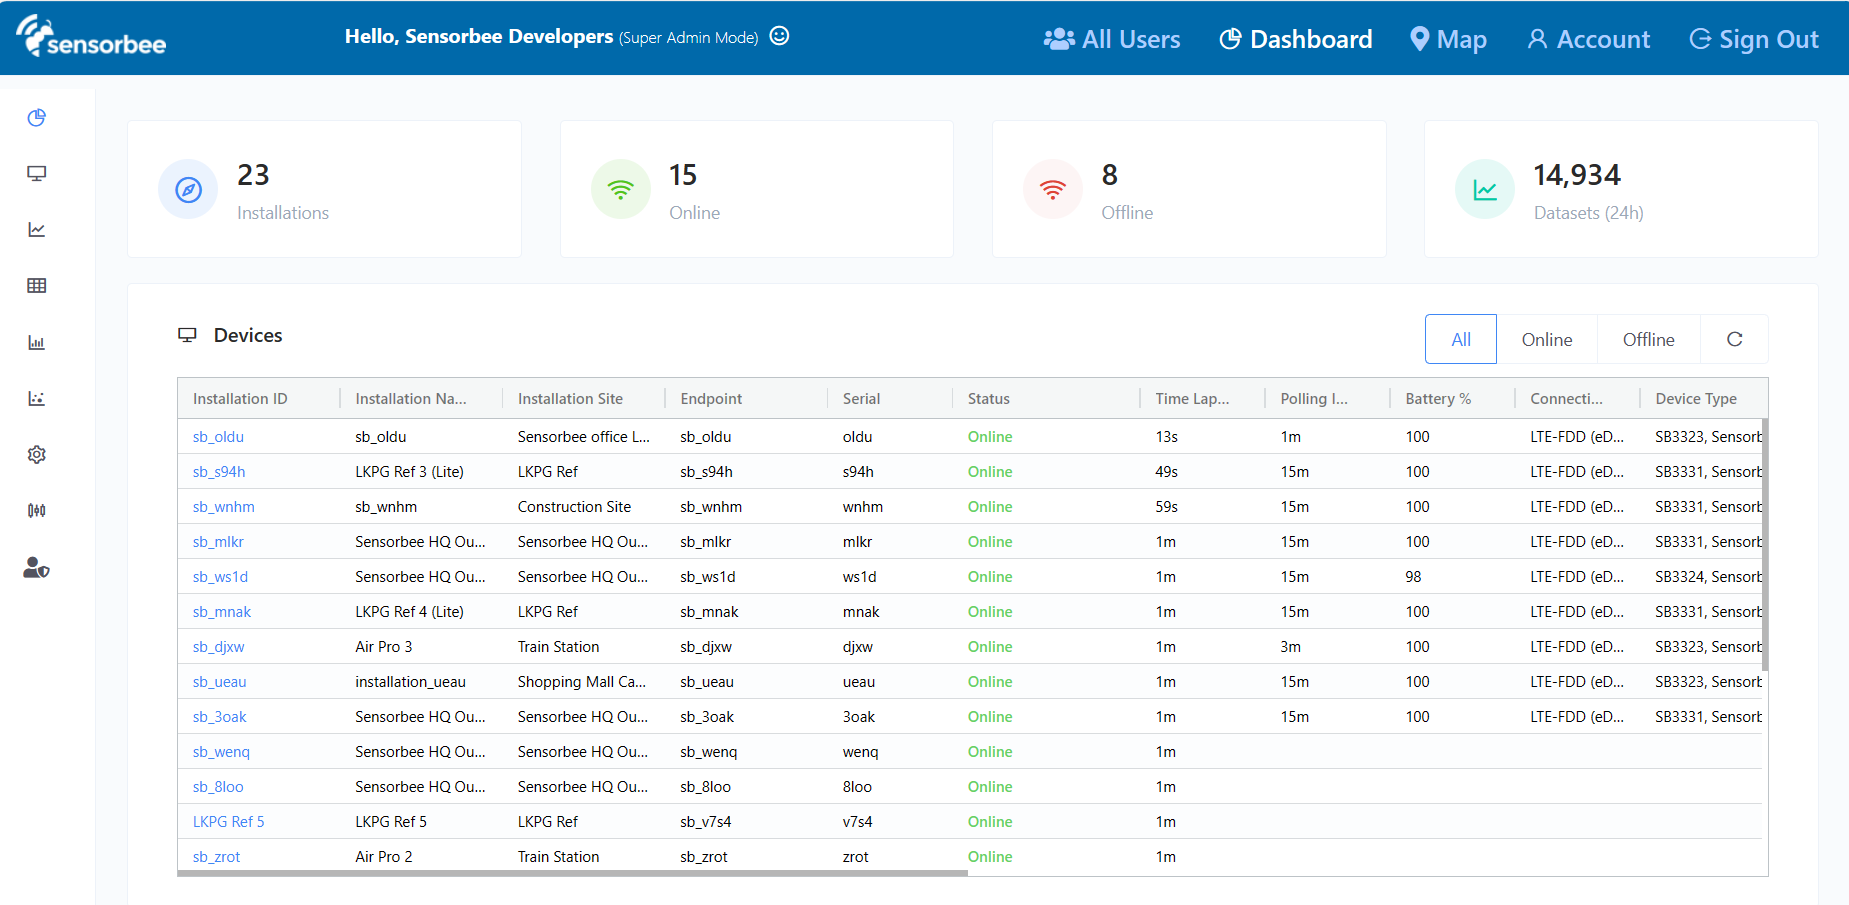
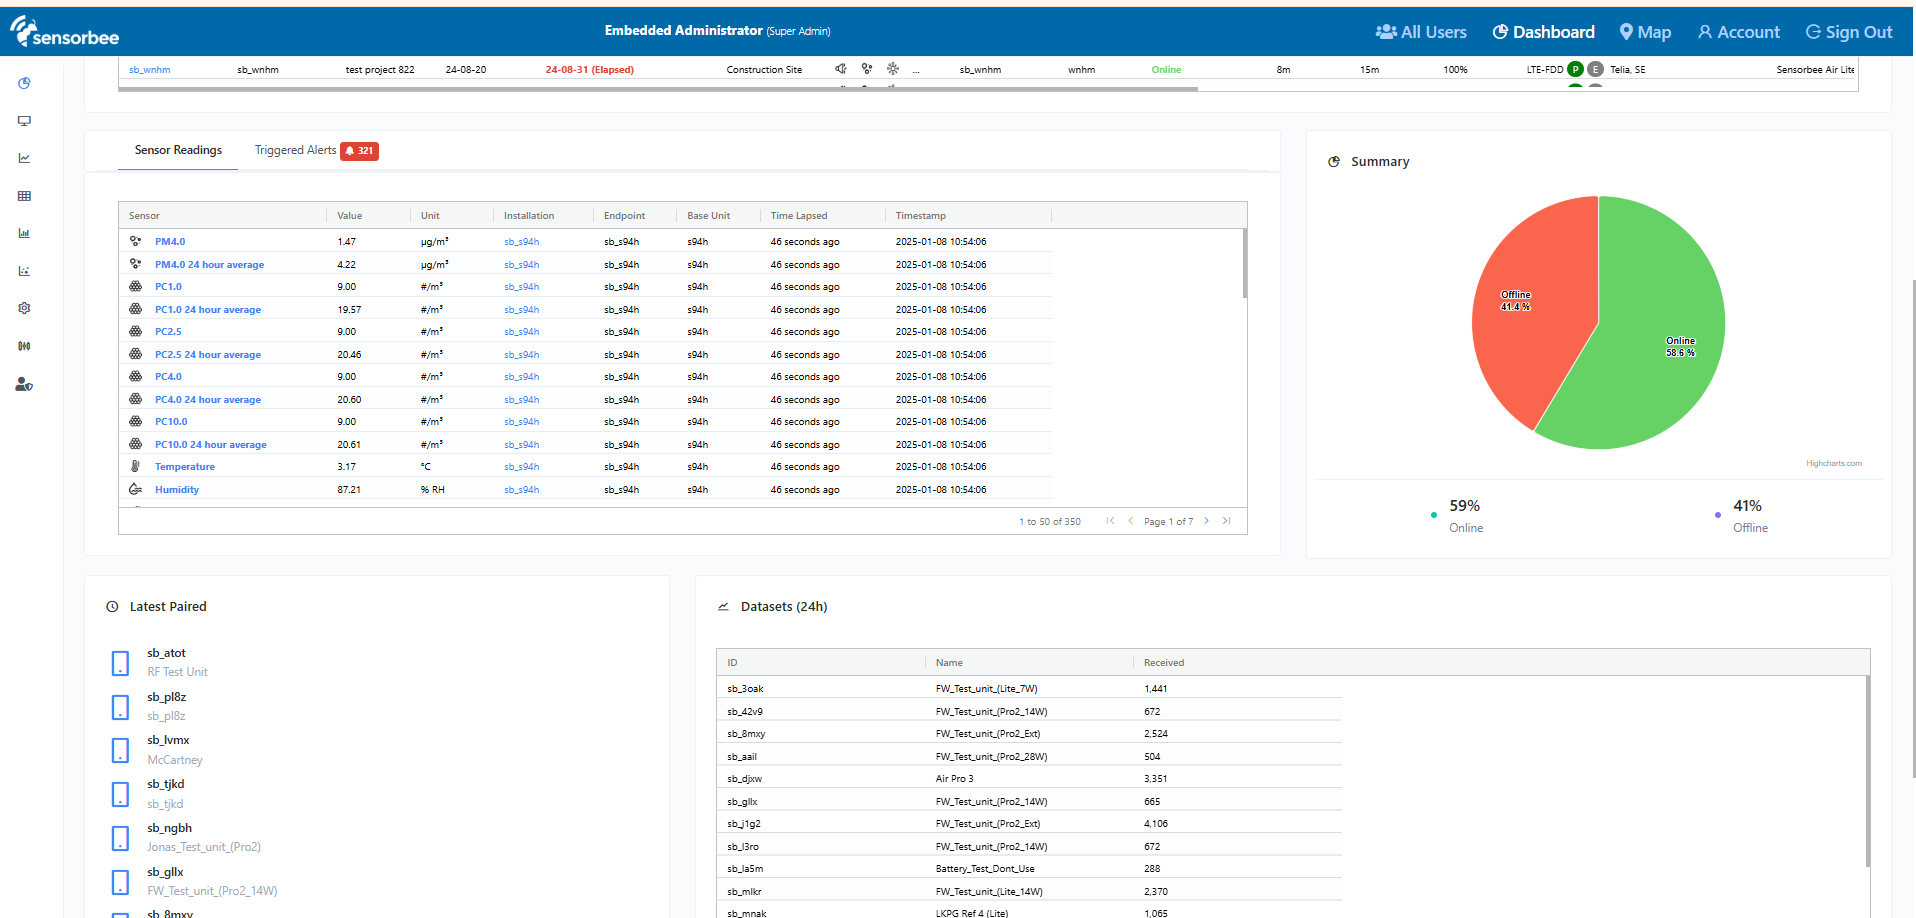
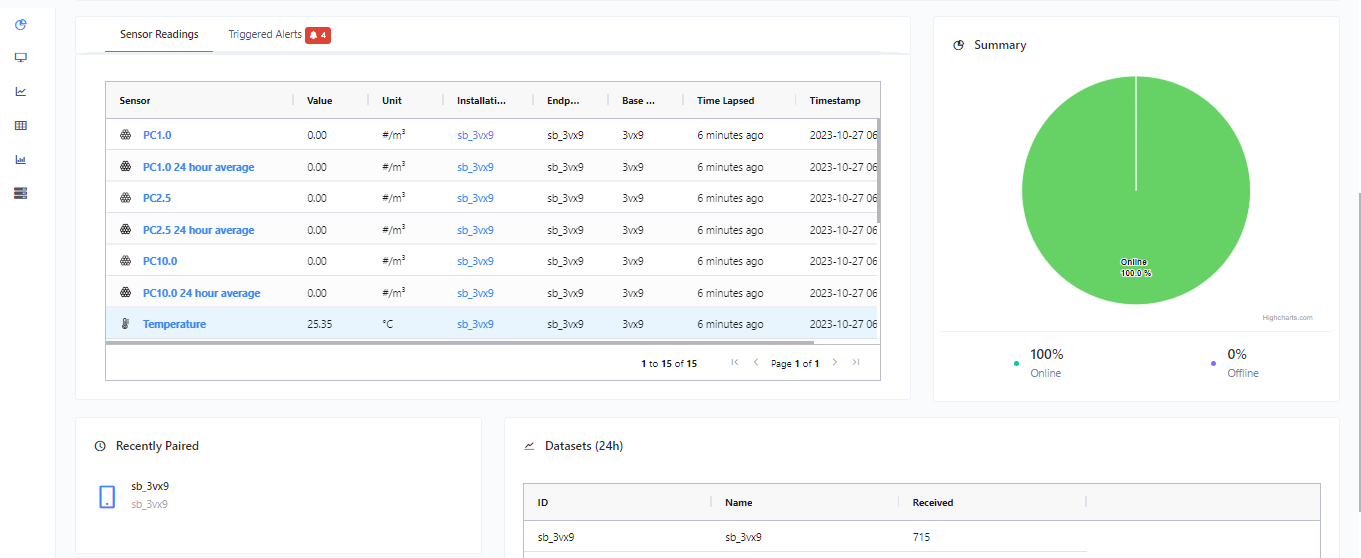
Figure 2 - Dashboard Lower Section
Different Sections
The dashboard is divided into different sections. Each section shows information that can help you understand the status of your devices.
- Statistics Section
- This section shows the total count of installation / devices registered to your account. It also specifies how many are online and offline, as well as how many datasets were collected for the past 24 hours.

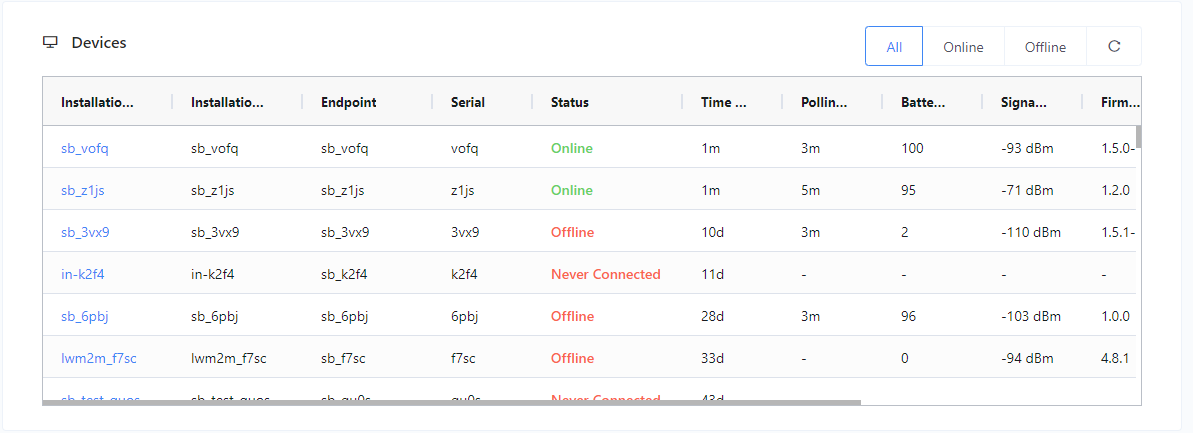
- Device List
- This section shows the list of installation / devices registered to your account. The grid includes important parameters like status, battery percentage, signal strength, firmware version and last report/seen time, that are useful for monitoring. Note: You can click on the installation ID to view the specific device information.
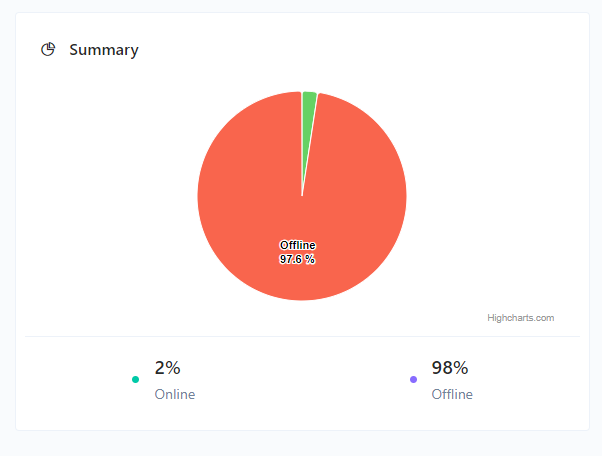
- Summary (Pie Chart)
- This section has a pie chart that shows the statistics of online and offline devices in percentage.
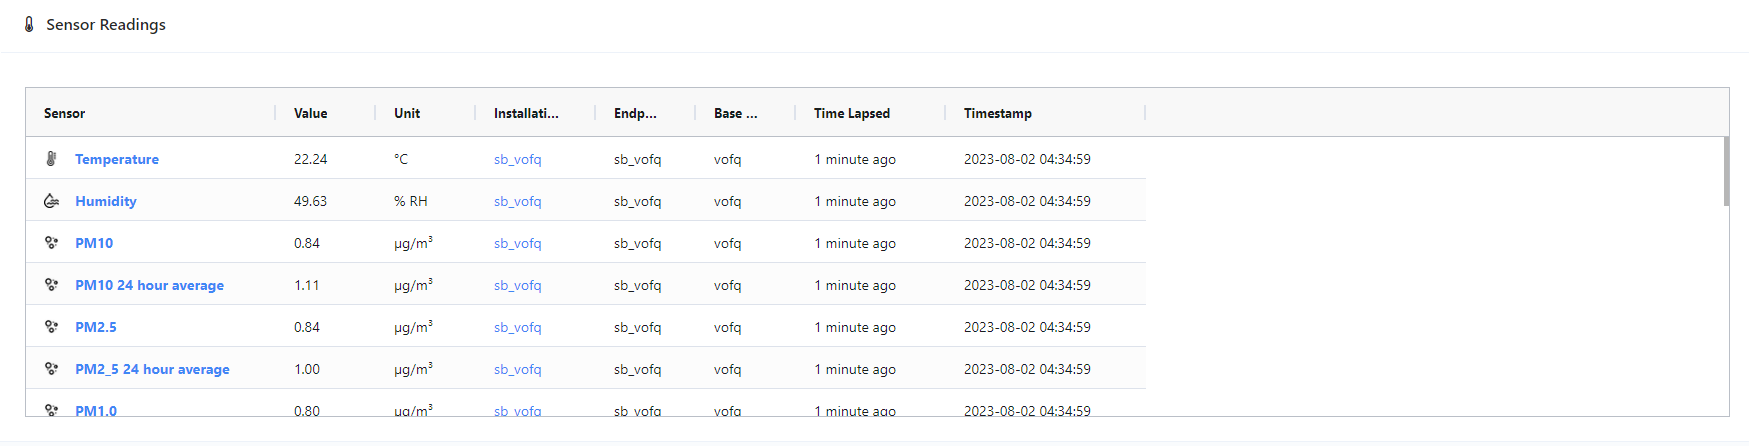
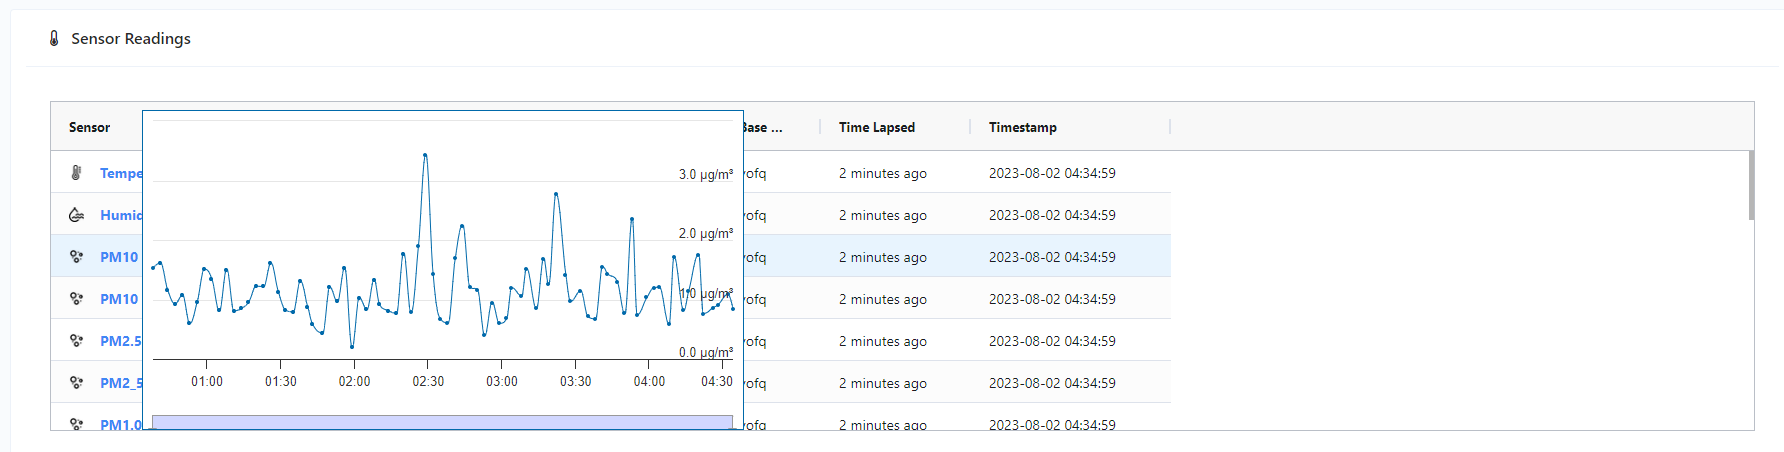
- Sensors Readings
- This section shows the recent sensor readings from your devices and the values here are refreshed every minute. You can hover over the sensor name to view a historical graph.
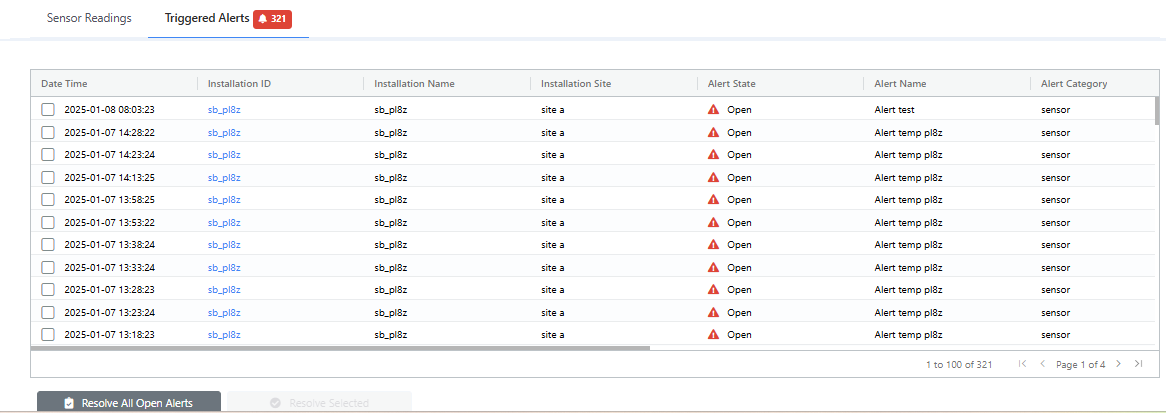
- Triggered Alerts
- This section shows the recent alert notifications from your devices. You can also resolve an open alert to monitor incoming alerts, distinguish it from the older alerts, or to check the alert state from the dashboard.
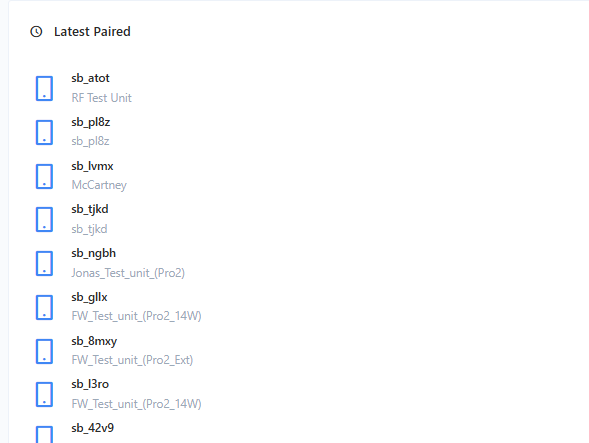
- Latest Paired
- This section shows the 5 most recently paired units. You can click on the name to go to the device information page.
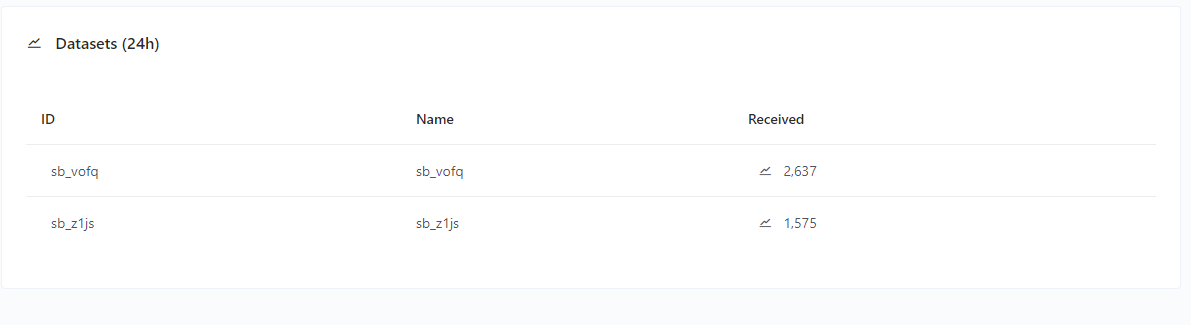
- Datasets (24h)
- This section shows the statistics of the collected datasets per device for the past 24 hours. Only devices that were able to collect sensor values, within the past 24 hours, will be included in this list.