
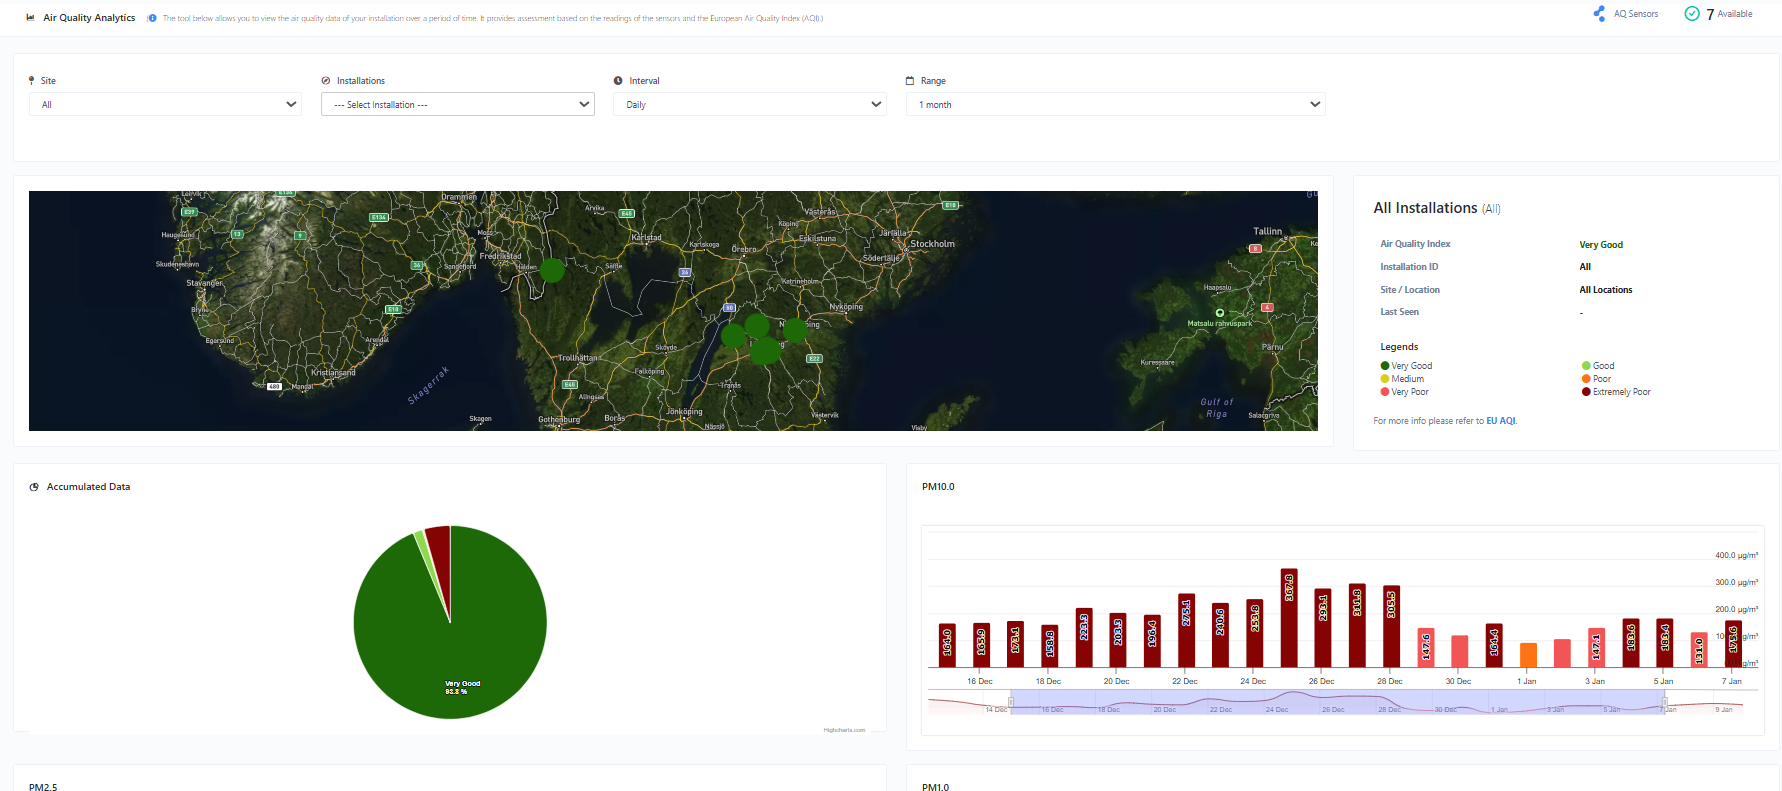
The Air Quality Analytics page provides a comprehensive analysis of the sensor values collected by air quality sensors. This analysis helps to better understand the air quality in a particular area and take measures to improve it.
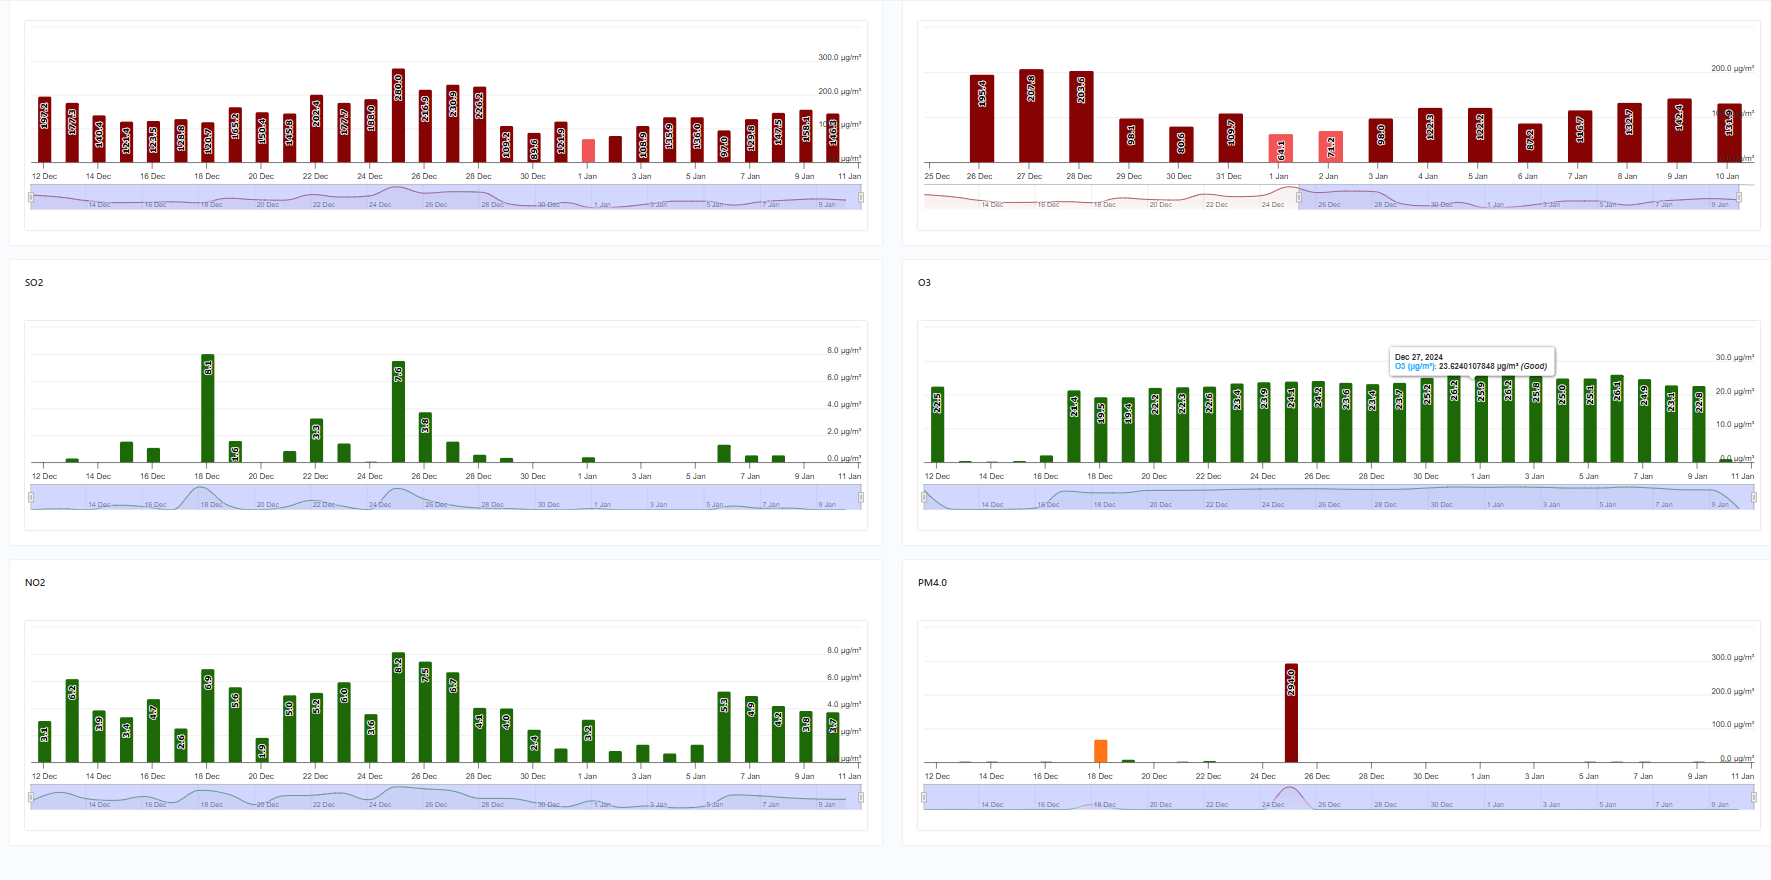
The page displays various analytics charts, tables, and graphs that show the sensor values for different pollutants such as carbon monoxide, sulfur dioxide, nitrogen dioxide, and particulate matter, together with their corresponding AQI assessment based on the European Air Quality Index standards. The charts show the trend of these pollutants over a period of time, which helps to identify patterns and correlations.
The page allows users to monitor the air quality condition of an area. This is particularly useful for areas that are prone to high levels of pollution, such as industrial areas and highways.
Controls / Filters
The following are the available filters that you can set:
- Site - Refers to the site name that is assigned to the installation. This groups installations with the same site name to assess their Air Quality Index as a whole.
- Installations - Refers to a particular installation / Device.
- Interval - You can choose the level of data granularity that you want to view in the result from this filter, either Hourly or Daily.
- Date Range - The time period you want to get data from.
Available Pollutants
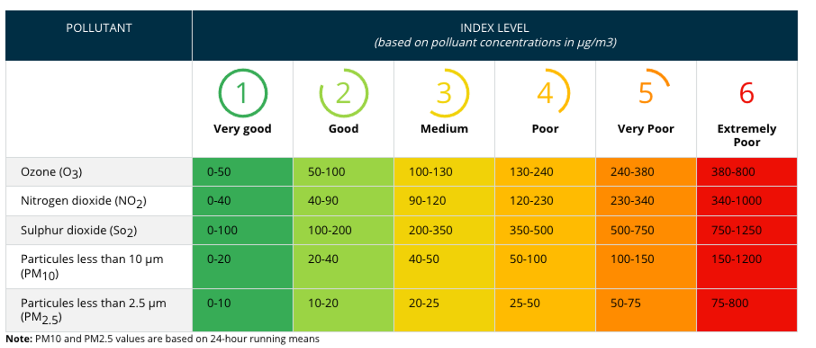
The European Air Quality index is computed for five main pollutants regulated in the European legislation. (see Reference)
- Ozone (O3)
- Nitrogen Dioxide (NO2)
- Sulphur Dioxide (SO2)
- Fine particulate matter with a diameter smaller than 2.5 micrometers (PM2.5)
- Fine particulate matter with a diameter smaller than 10 micrometers (PM10)
Therefore, the charts in this page will follow the same color scheme as to the figure above based on the sensor values’ AQI assessment result.
Important Notes:
- The Air Quality analytics page is only available for accounts with Sensorbee Cloud Analytics Package.