The Historical Data page provides a comprehensive overview of all the data collected by the sensor over a specified period of time. This page is designed to help users analyze and understand the trends and patterns in the data collected by the sensor.
The page allows users to specify the time range for which they want to view the data. They can also filter the data based on specific parameters such as temperature, humidity, pressure, and so on. The page displays the data in the form of graphs and charts, which makes it easy for users to visualize the data and identify any trends or patterns.
Users can also interact with the data on this page. They can zoom in and out of the graphs and hover over specific data points to view their values.
Available Filters:
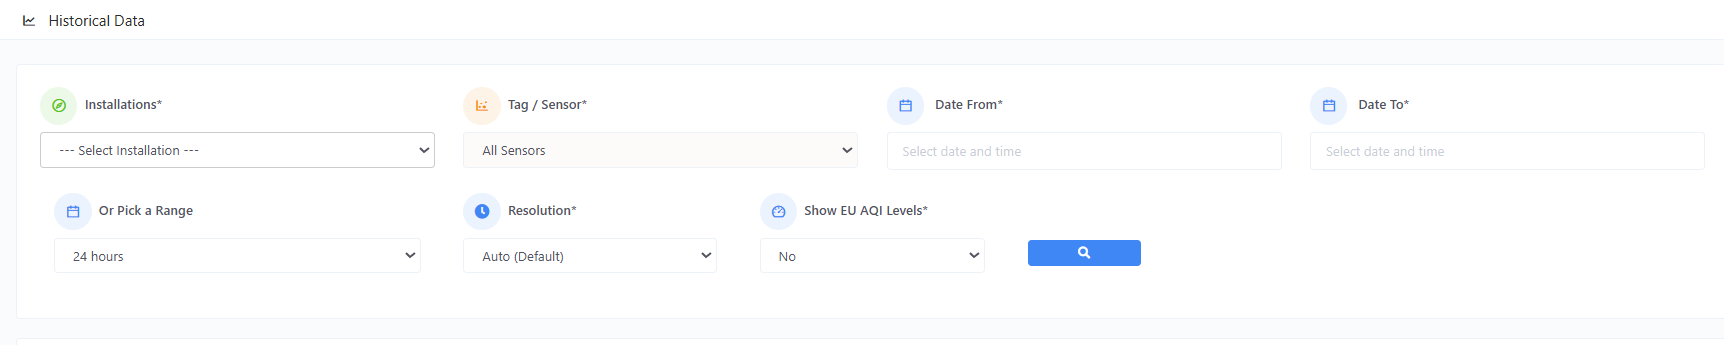
Figure 1 - Available Filters
- Installations
- You can select here the specific installation / device to view.
- Tag/ Sensors
- Provides you a list of available sensors to choose. You can either select a specific sensor, or select all.
- Date From & Date To
- These are datetime pickers that allow you to specify a particular range’s datetime from and datetime to.
- Range Picker
- These are quick range filters that you can choose if you opted not to specify the datetime from and datetime to.
- Resolution
The granularity or level of detail in the data collected and displayed by the system, typically defined by the sampling intervals or spatial precision (e.g., hourly data, 1-meter grid). Higher resolution allows for more accurate and detailed analysis of air quality patterns, while lower resolution may reduce data processing requirements.
- EU AQI Levels
An optional feature that enables the display of air quality levels using the European Air Quality Index (EU AQI) standard. The EU AQI provides a clear, unified framework for interpreting air pollution data across Europe, categorizing air quality into predefined levels (e.g., Good, Moderate, Poor) based on thresholds for pollutants such as PM2.5, PM10, NO2, O3, CO, and SO2.
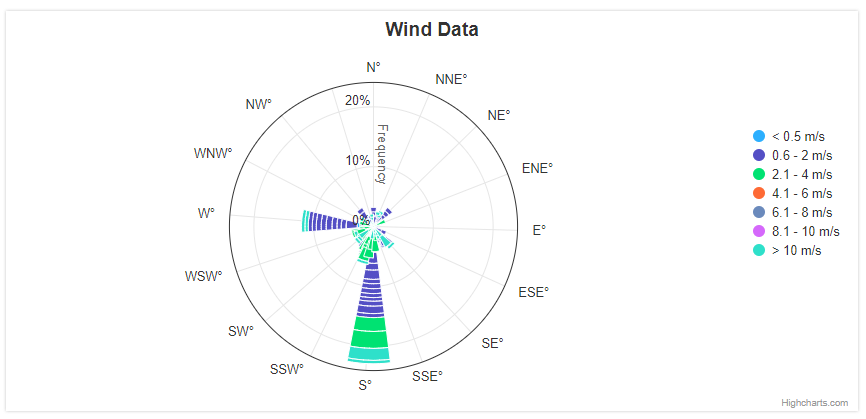
Result Chart:
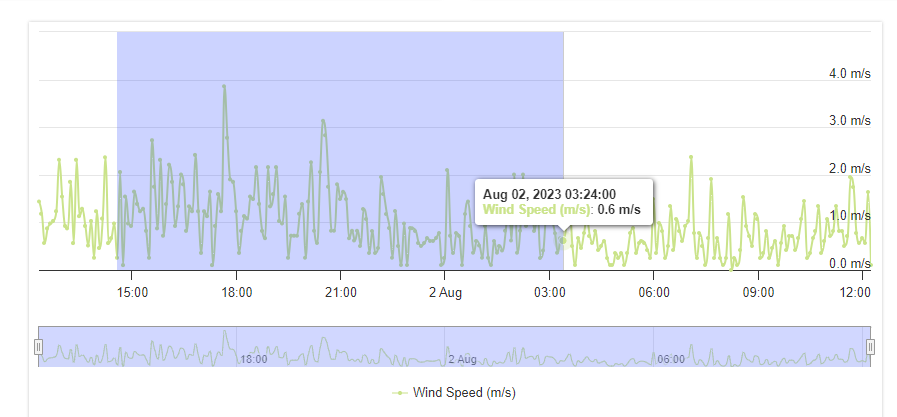
- The historical data of most types of sensors will be displayed in a time series line chart.
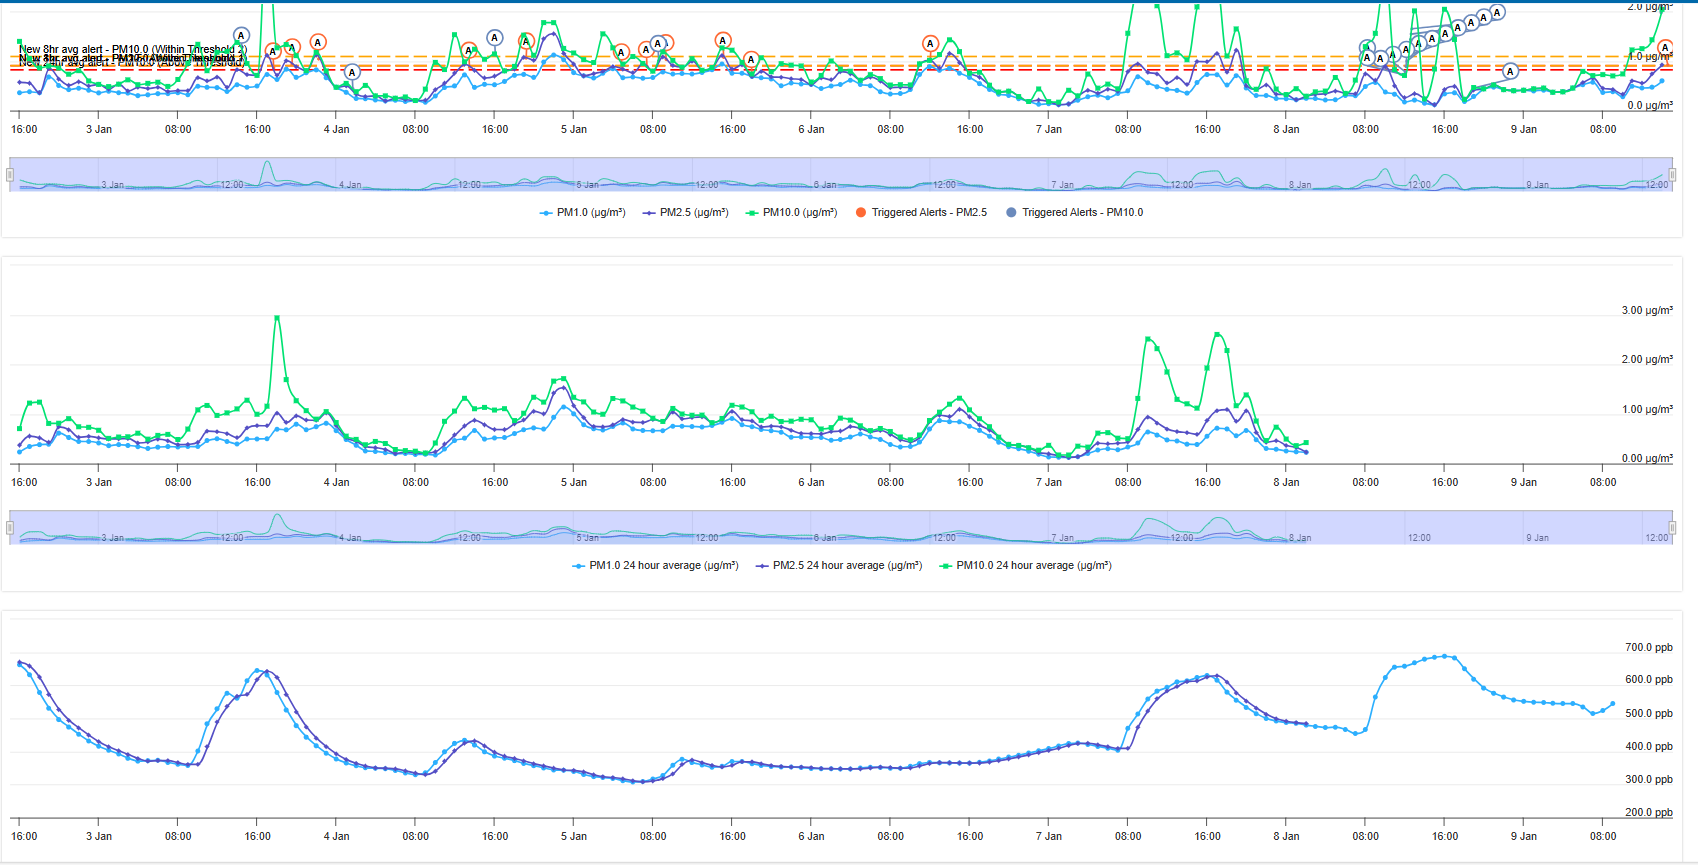
Figure 2 - Time series line chart
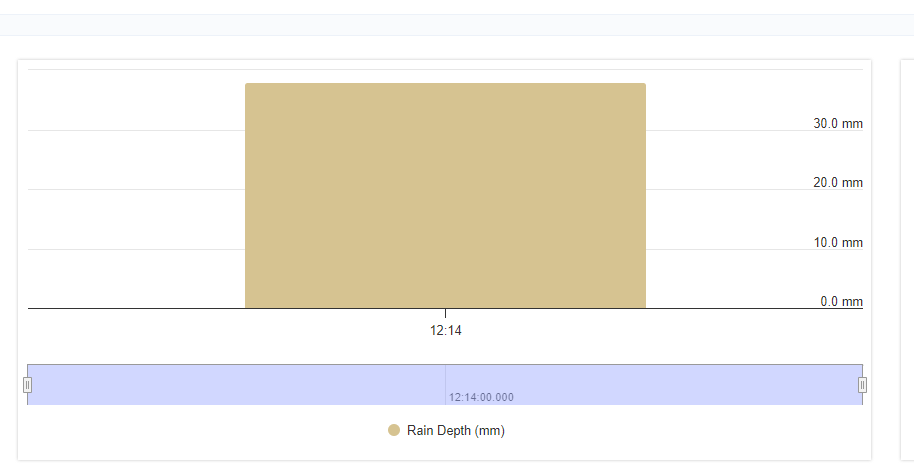
- However, historical data for the Rain and Wind Direction are displayed in an Accumulated bar chart, and Wind Rose respectively.
- The result chart also has a navigator that allows you to zoom in and out of a particular range within the time series.
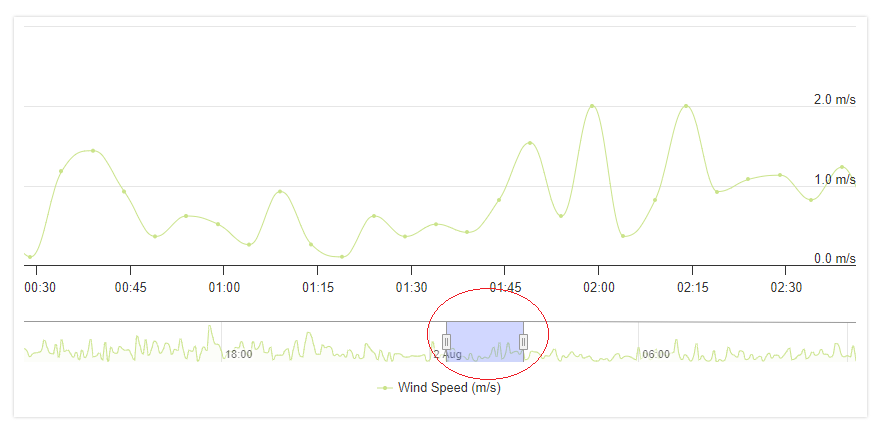
- Alternatively, you can zoom-in by just selecting a specific range within the result chart.