The Sensorbee Map View is a feature that allows users to visualize data in a geospatial context. It provides a graphical representation of the device data on a map view. It is also designed to be user-friendly and provides a range of tools for data exploration and analysis.
Users can zoom in and out of the map, pan around to explore different areas, and click on data points for more information.
The map view also supports time-series data, allowing users to see how data changes over time. There are available sensor layers that would allow user to visualize the changes. This documentation aims to guide you on how to make use of the available controls and filters.
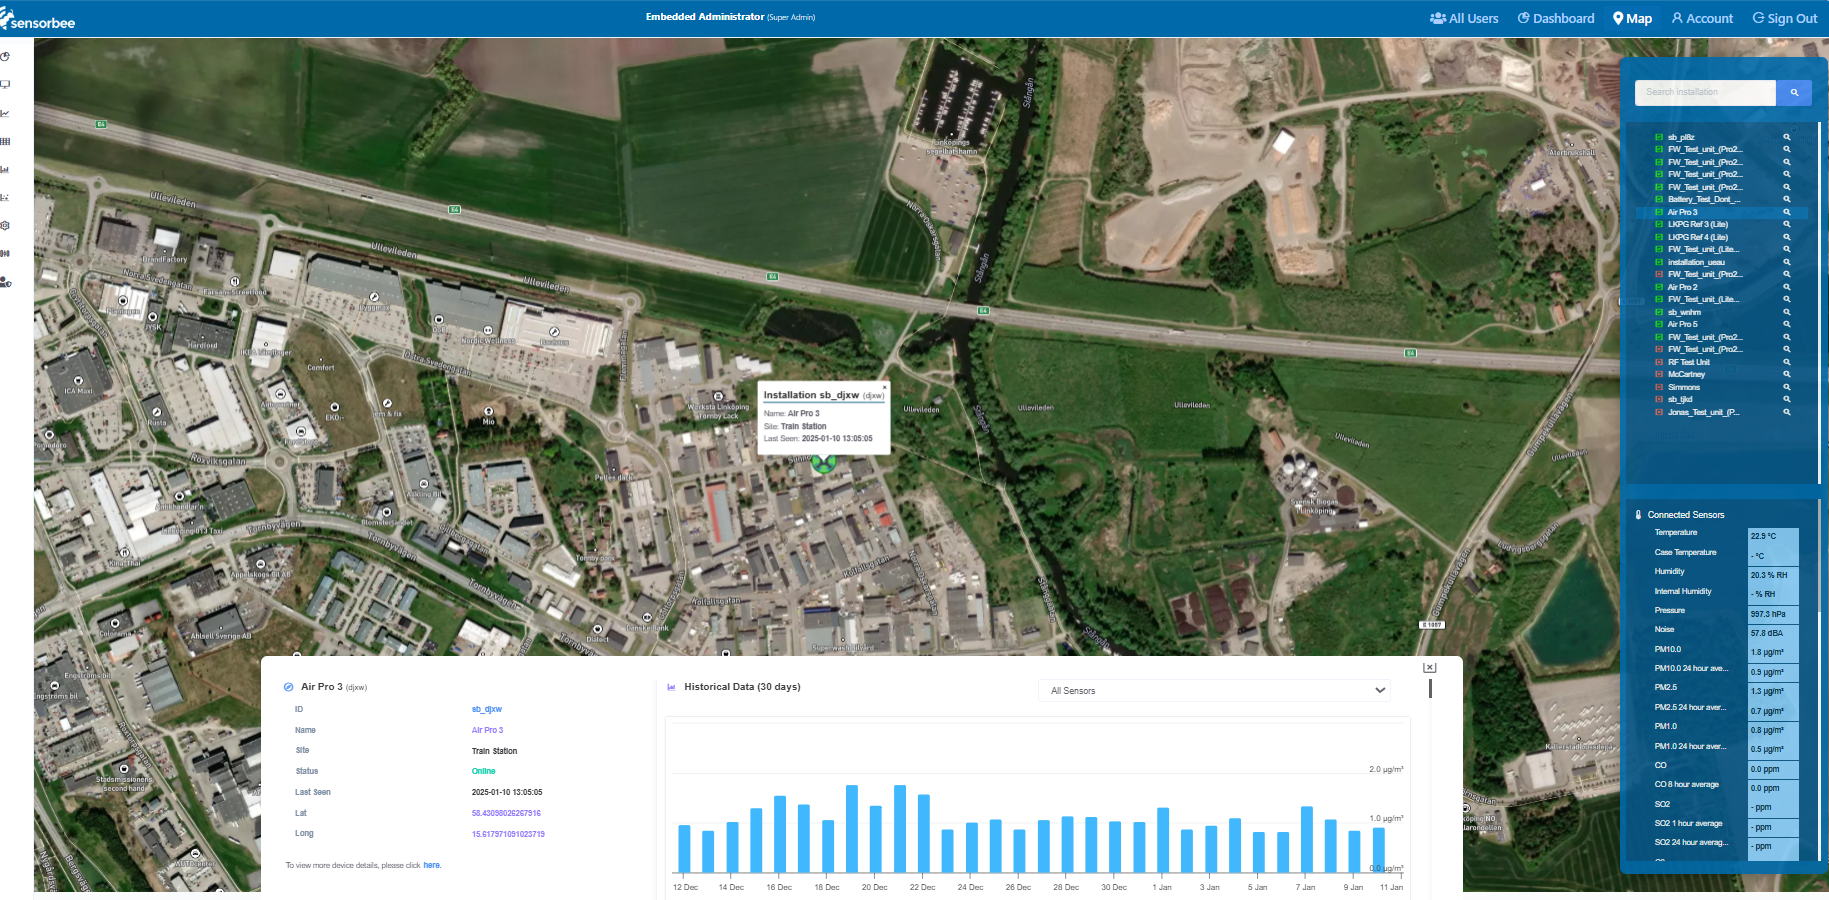
Figure 1 - Map’s device detail
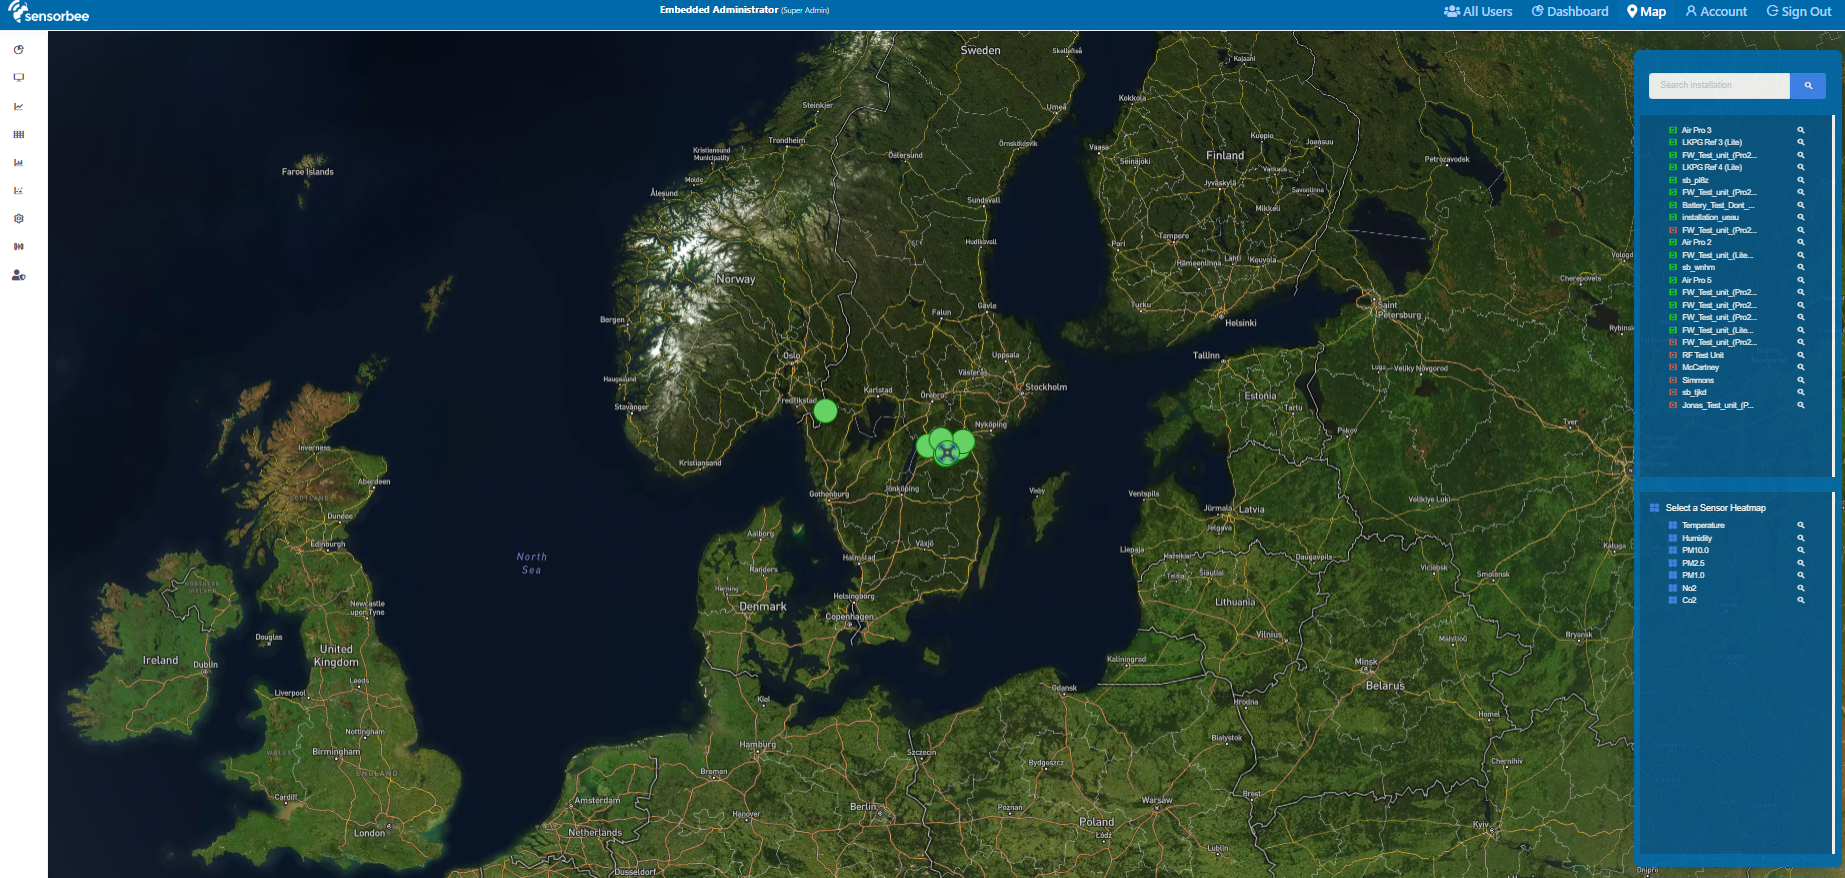
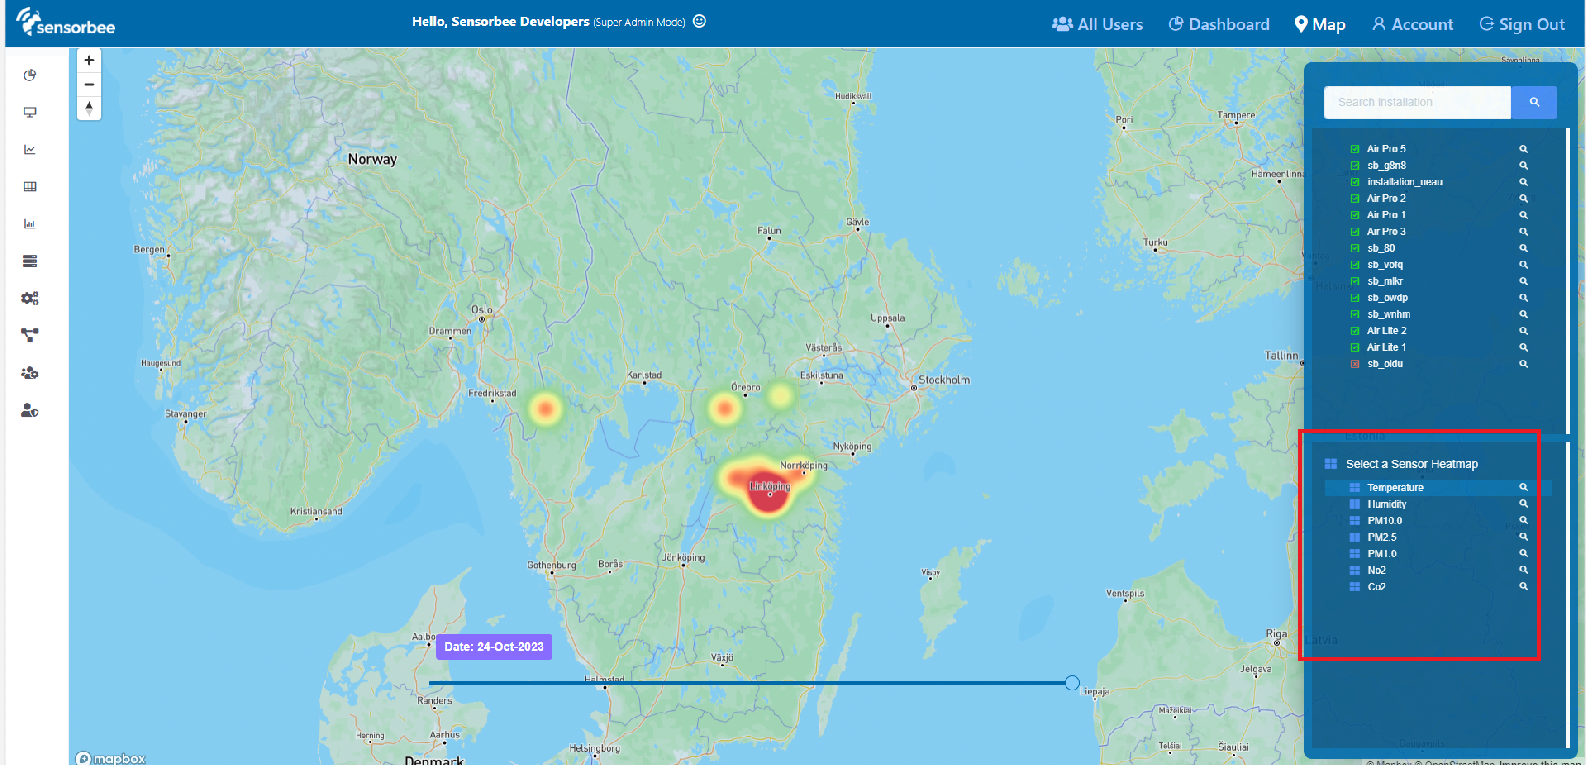
Figure 2 - Map’s sensor layer
Available Features
This section talks about the features and controls available in the map view. Please refer below for your guide.
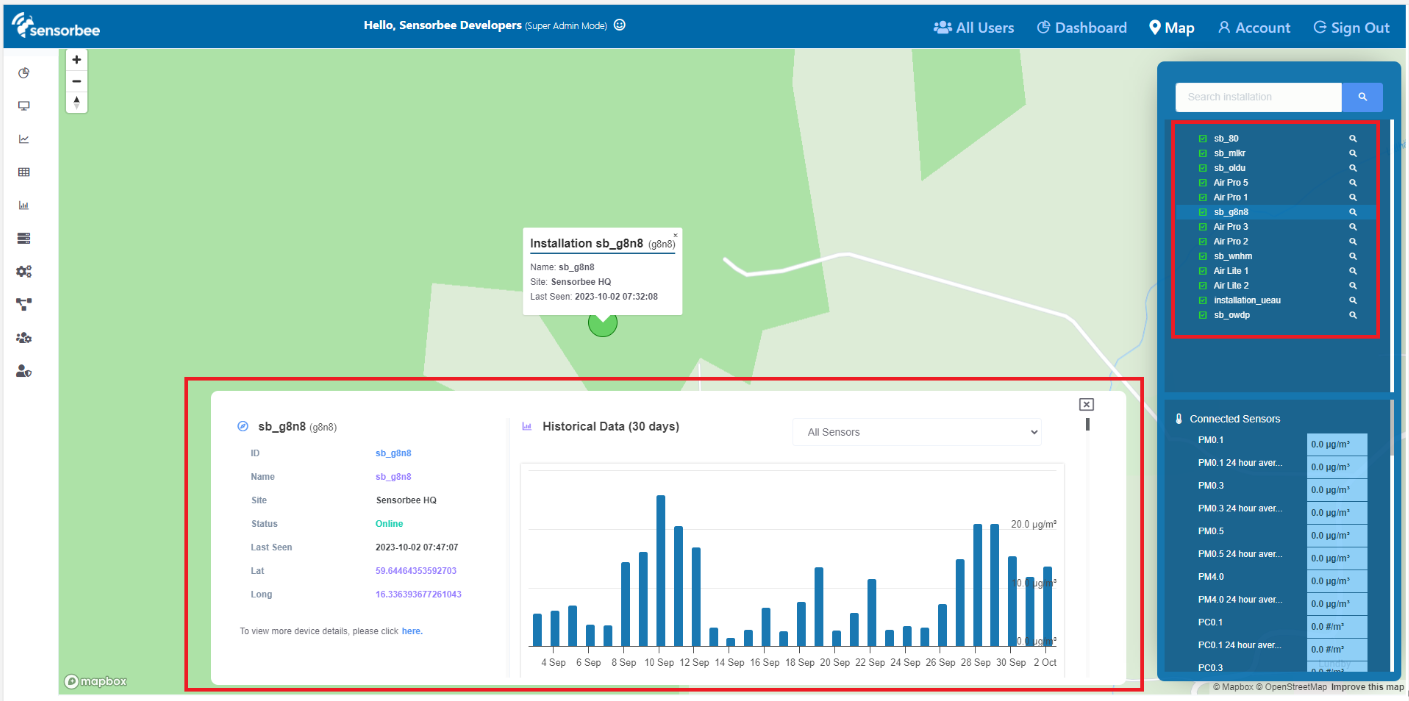
- Device List and Info - The upper right section of the map provides a list of installations / devices that you can search on and view. Once a device is selected, you would be flown towards its location (if GPS is available) and a modal, containing the device info and historical graph, will pop-up.
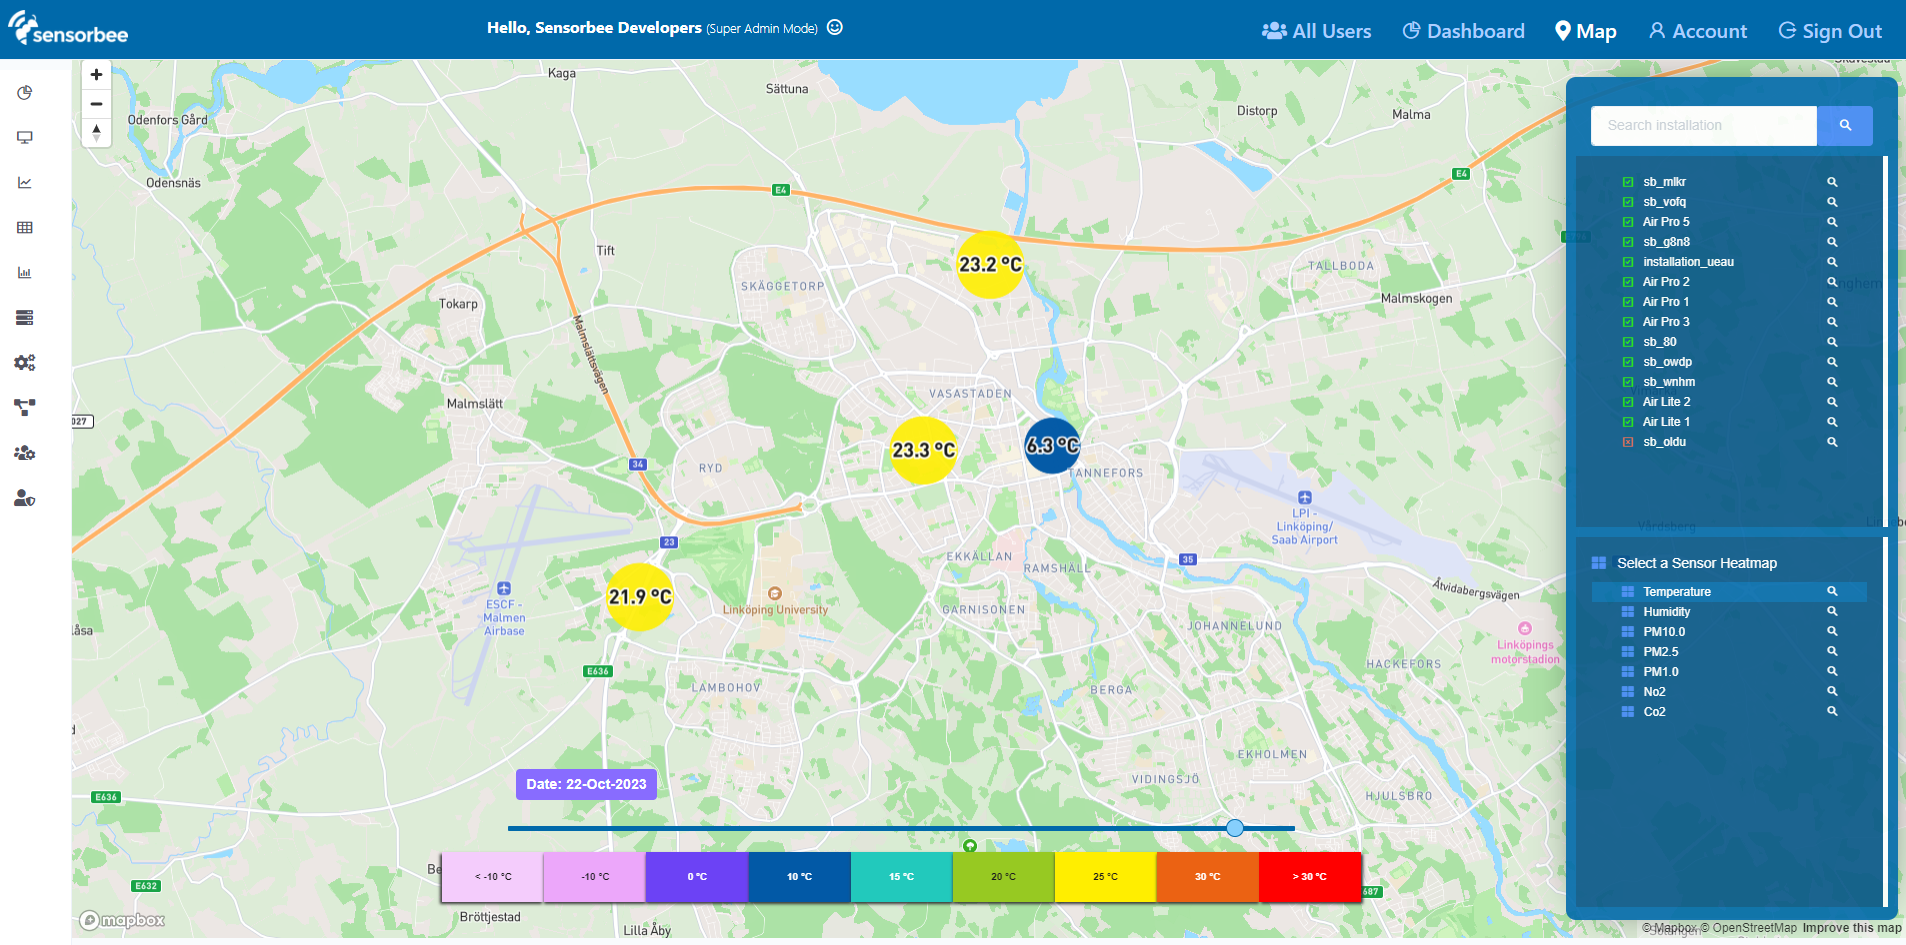
- Heatmap
- You can view the sensor heatmap by selecting from the heatmap selection on the lower-right section of the screen (please see the image below). The heatmap represents the average sensor reading and the data density gathered daily in an area. As you zoom further, sensor layers will replace the heatmap (see next bullet).
- Sensor Layers
- Each of your devices would be represented by a “circle” on the map, following a color coding based on the legend below. Each sensor layer has its own set of legends and color coding depending on the sensor readings.
- Additionally, you can drag the slider to see the changes of the readings over 30 days.