
This calibration process entails adjusting the sensor's span by identifying a time frame where the gas concentration reaches a maximum reference value, or alternatively, a significantly high value. This adjustment allows for the modification of air quality sensors' sensitivity, resulting in appropriate changes to the concentration span.
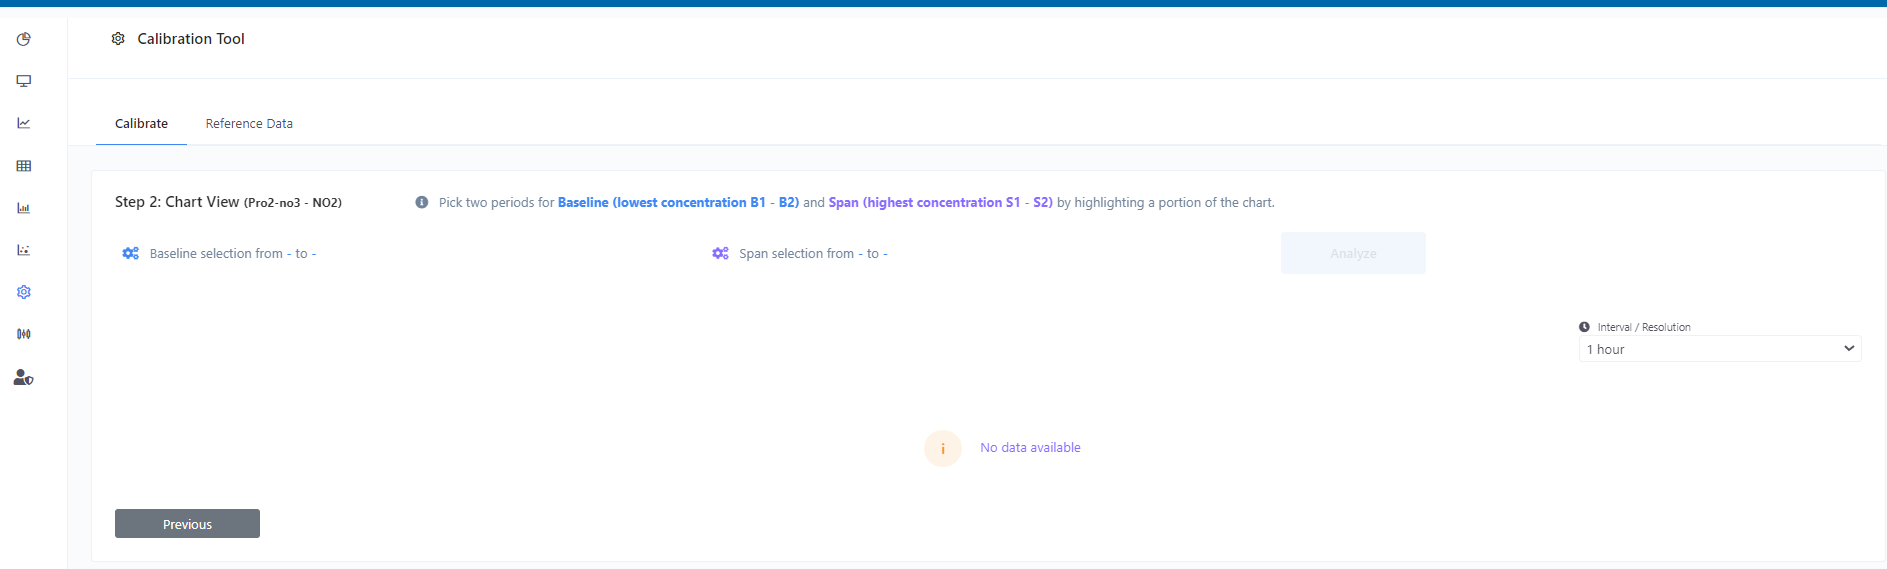
Step 2 for Calibration:
- Pick Baseline Periods:
This step involves selecting two periods with the lowest gas concentration, B1 and B2. This establishes the baseline for the calibration. The baseline periods should be chosen by highlighting the corresponding sections on the chart.
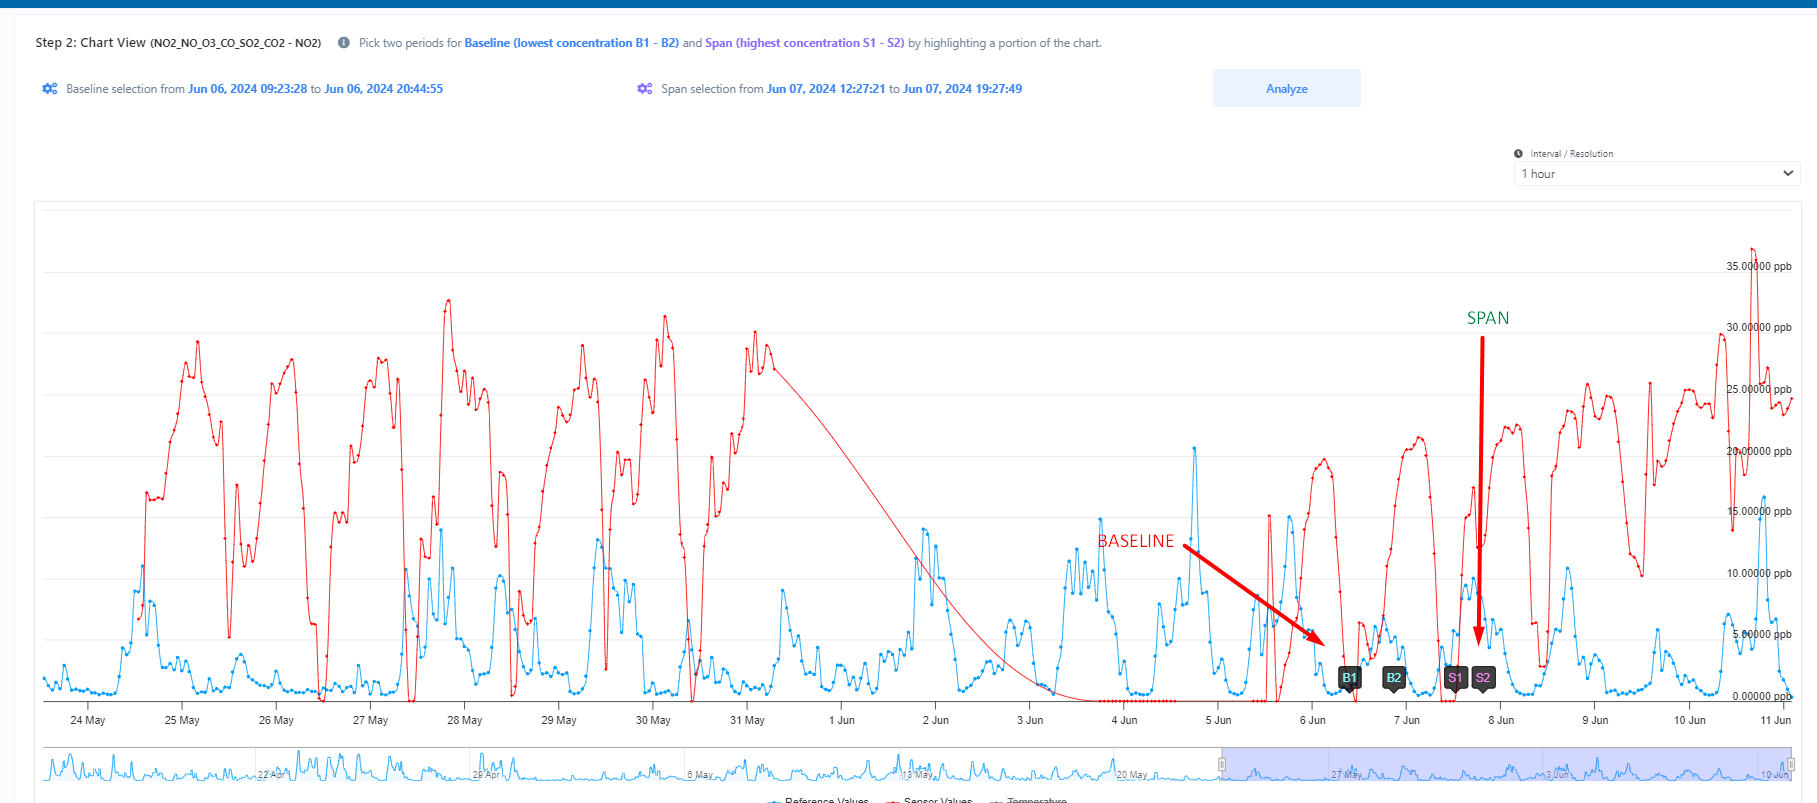
- Pick Span Periods:
In this step, you will need to select the highest gas concentration periods, S1 and S2, to define the span. Similar to the baseline, these periods should be highlighted on the chart. The span allows the calibration to account for the highest expected gas concentration.
- Click on Analyze:
After selecting the baseline and span periods, click 'Analyze' to start the calibration process.
- Offset and Factor Values
By choosing the offset and factor values, you can preview the chart in two modes:
- Both the span and baseline
- Only the baseline
This allows you to visualize either the full range (span) and average (baseline) of the data, or focus solely on the baseline trend by selecting the appropriate preview button.
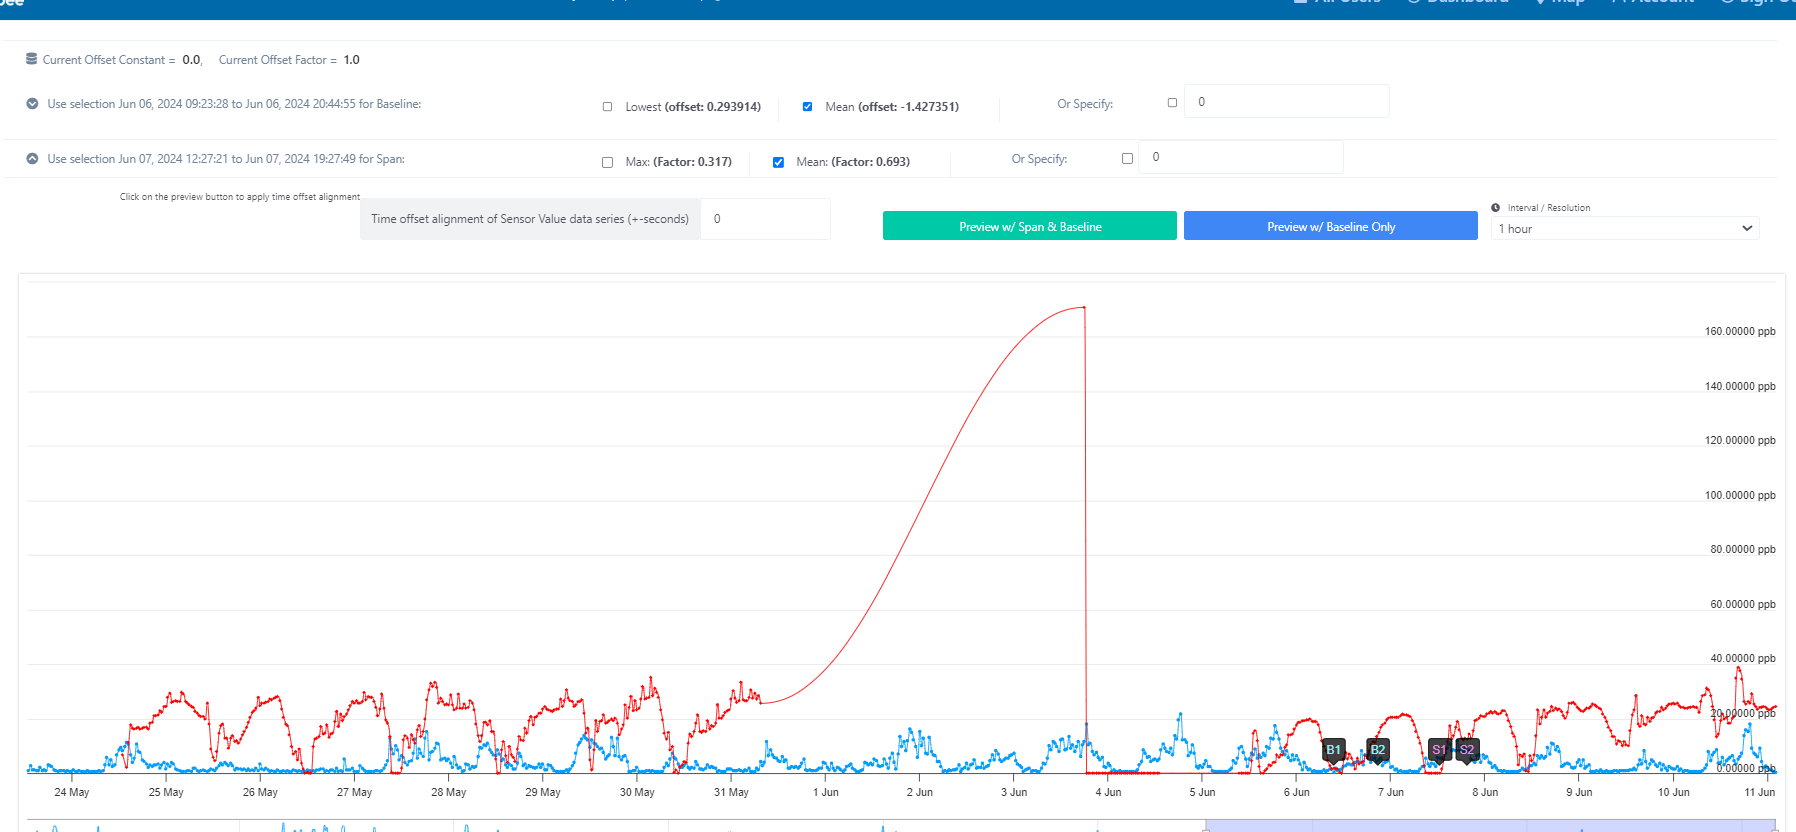
After previewing, you can apply the selected offset and factor calibration to the actual data by clicking:
- "Apply Span Calibration" to adjust the full data range
- "Apply Baseline Calibration" to adjust only the average trendline
This provides flexibility to fine-tune the displayed data span and baseline independently based on your calibration settings.